Completed
-
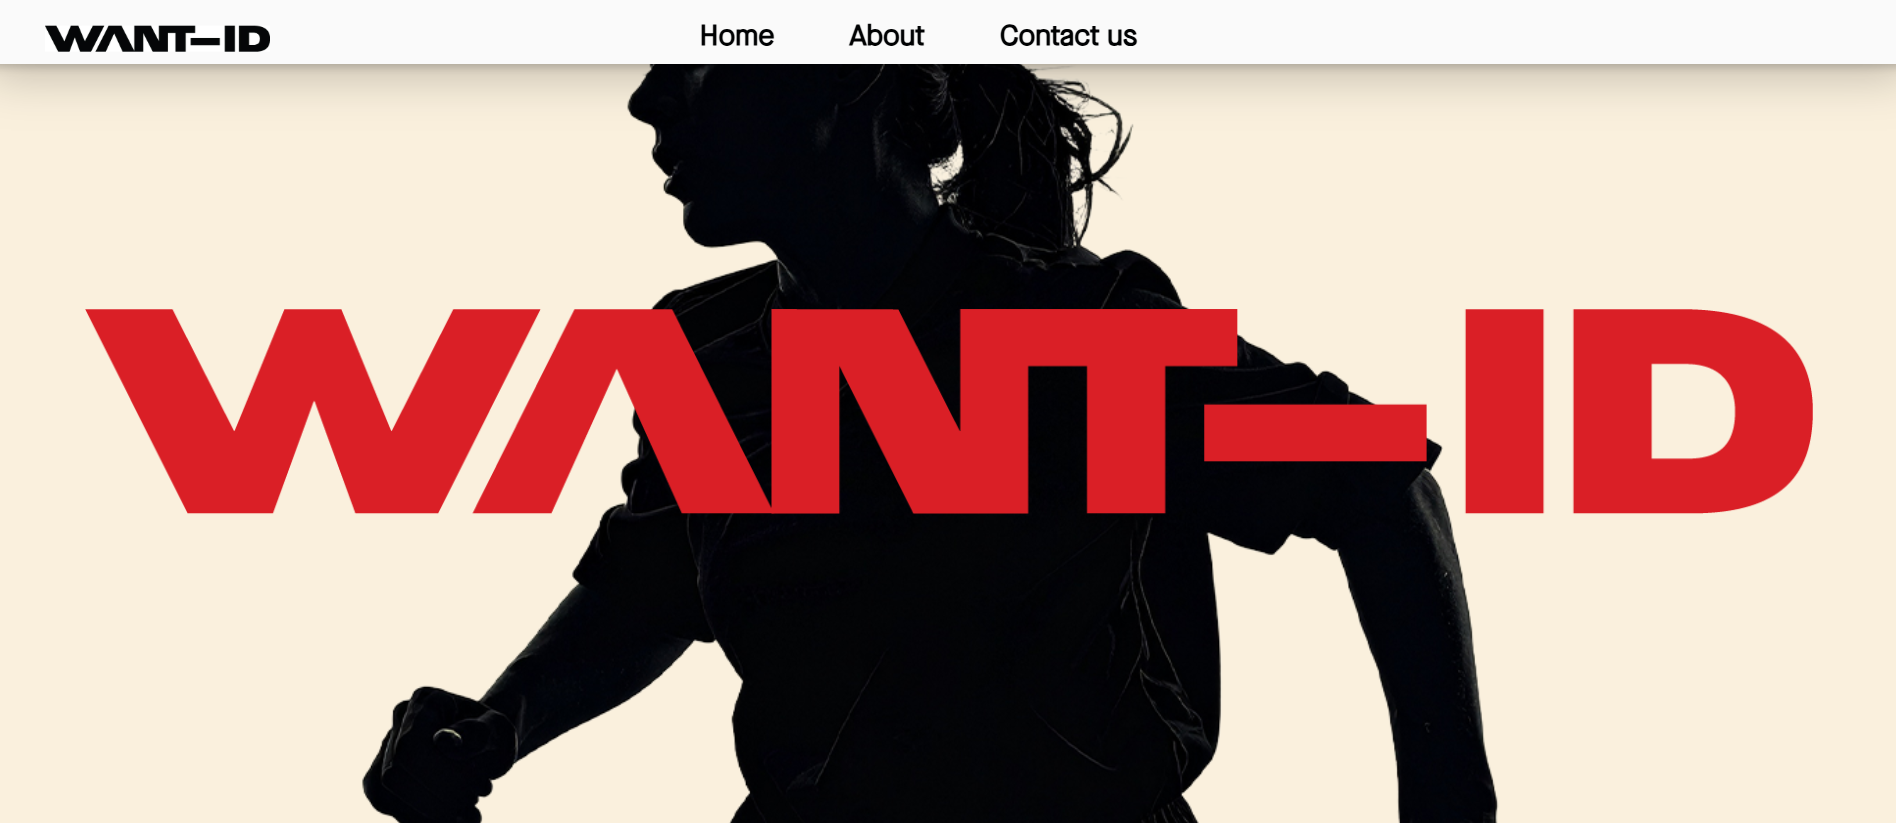
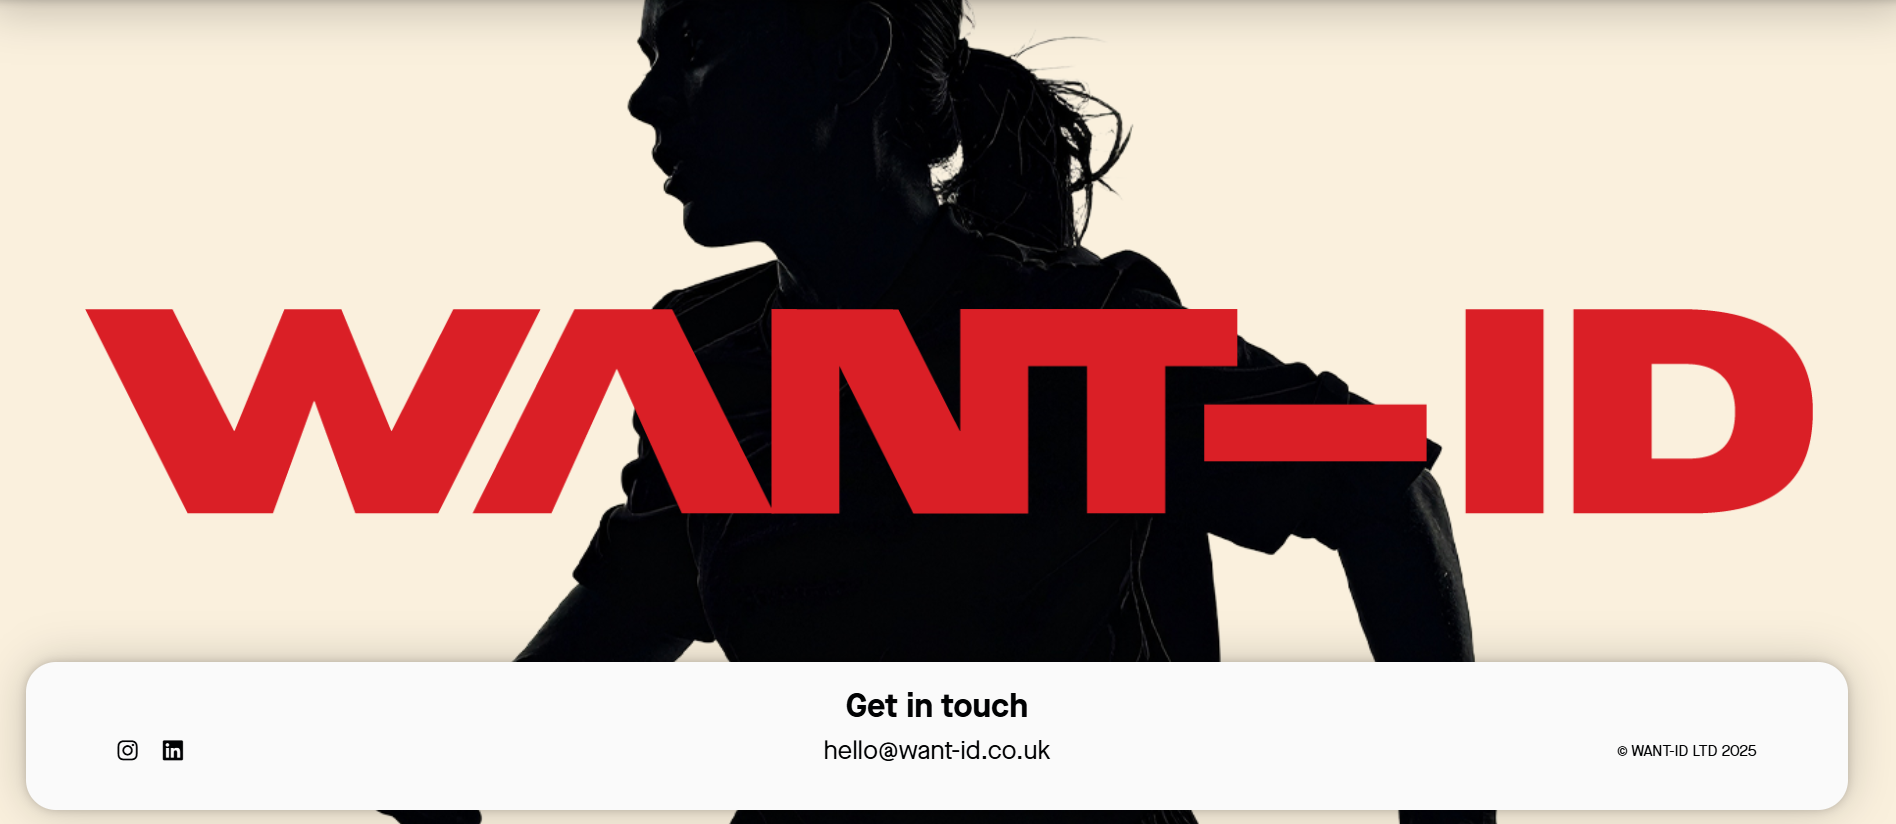
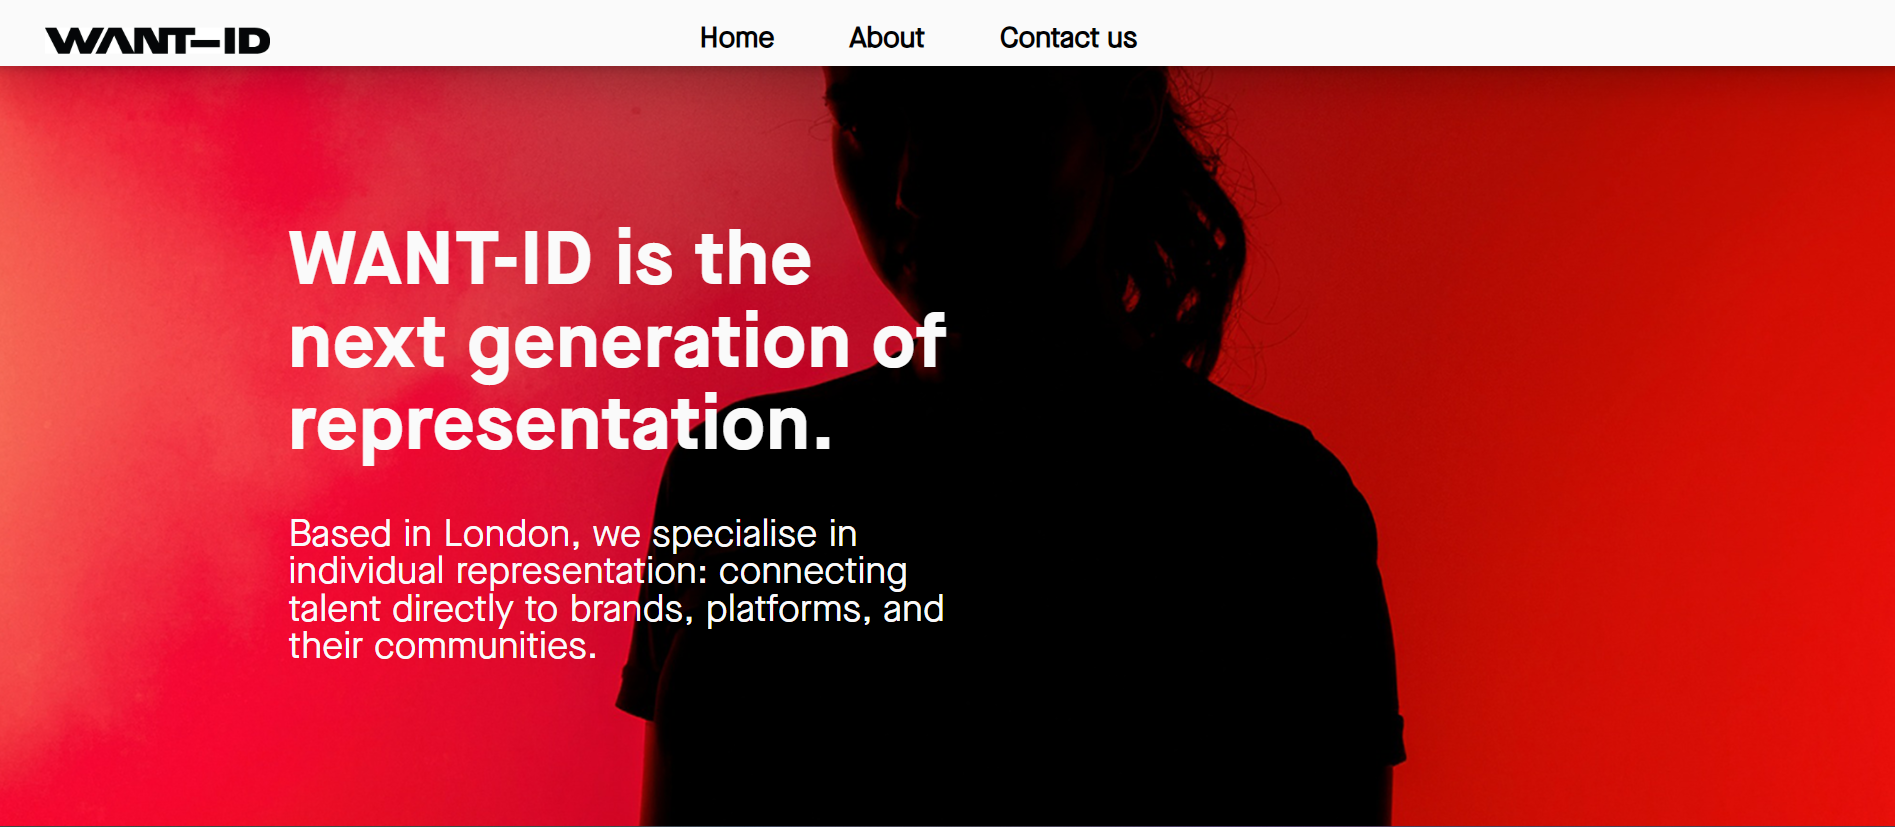
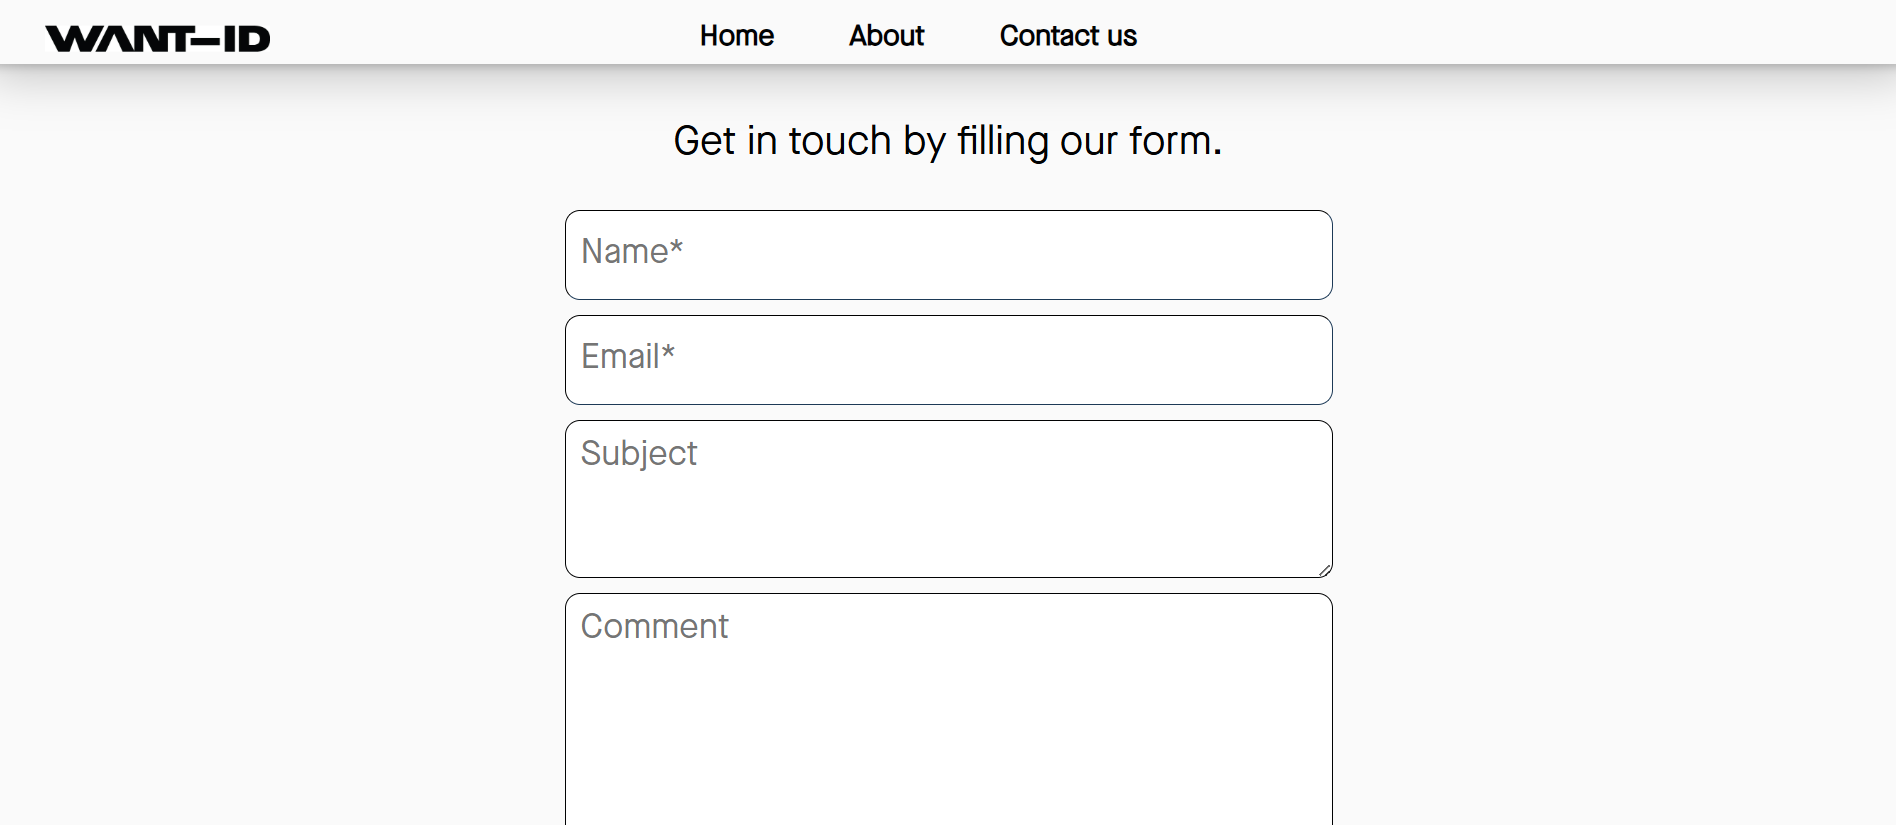
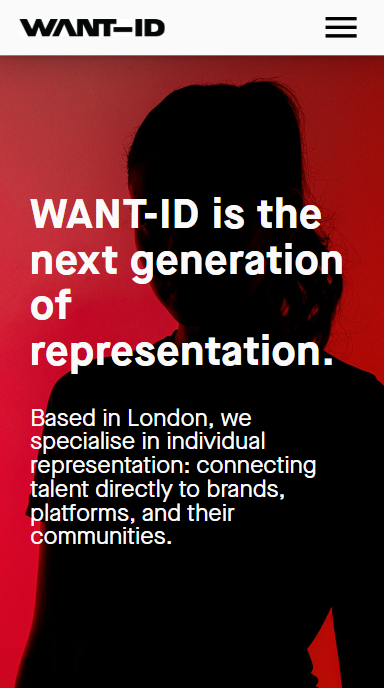
Designing and building a website for WANT-ID
When I was developing a website for WANT-ID, they were a new talent management company, looking to make an impact on the industry by pushing for more individual representation.
They wanted a clean, impactful website that conveyed not just who they were, but also their philosophy and flair, their vibe.
Working with a graphic designer, we were able to create a website which, on first click, informs you of the disruptive nature of WANT-ID.
Overall, I enjoyed the experience. I am very much a creative person, and not a lot of times in life do you get to sit down and create.
Much of the material showcased on this card is the intellectual property of WANT-ID LTD. I appreciate them letting me display the work I did for them.
-
-
Making a workflow involving LLMs for Overstone Art
In my internship with Overstone, I was tasked with creating a workflow to fill in missing data about pieces of artwork.
For a particular piece, we may not know its creation date or its medium, for example. This information may be available on the internet but not accessible via traditional scraping methods. Therefore, a more intelligent scraper, one that pairs a search tool to scrape and an LLM to discern, is required.
I built this as a graph in LangGraph which involved using search tools and LLM calls. Unfortunately, as it comes under Overstone's intellectual property, I cannot reveal the details of the graph or show its results, yet it was adequately complex (I promise!).
Overall, I learnt how discerning LLMs can be. In particular, I was surprised at how accurate they are when estimating the validity of their own answers.
Throughout, my Python skills really improved and I learnt to use packages like LangGraph, Marimo, and Polars.


In Progress
-
Modelling predator-prey dynamics using stochastic individual-based models
I am currently in my third year of my maths degree and, for my full-year project, I am working on the creation of different models to simulate the interactions between predators and prey.
My models work by placing predators and prey on a grid, allowing them to move in a defined way for every step in discrete time, and setting rules regarding how they interact if they meet and how they reproduce and die. I currently have the predators and prey moving with random walks which can mean that simulations with the same initial conditions can have wildly different results (see the last slide). (Results being defined as the change in population counts of the two species over time.)
I have set up one of the models with rules that follow the assumptions of the famous Lotka-Volterra model. The results can sometimes follow the same oscillatory pattern as the results from the LV equations do, but more interestingly are the ways that the results tend to differ from it.
One of the most difficult problems in this project is to decide how to display the results of a simulation. My favourite way that I came up with is to encode (for every time step) the number of predators at a grid point as a value from 0 to 255, and the same for prey. Then I use these values to create a picture of the map with the predator value as the red value in RGB and the prey value as the blue value. This allows you to watch what happens over time in the simulation and is quite fun! Watch the simulation in action on the first slide.